Google Reports. COVID-19 and Changes in Mobility Trends
For several months, Google has been publishing reports and updating data on people's mobility. They are available on the website https://www.google.com/covid19/mobility/?hl=pl
Statistics presented in the reports were developed based on aggregated data from users who had location history tracking enabled on their smartphones. The data shows how the number of visits to places such as grocery stores, recreational areas, and workplaces changes in individual countries and regions.
The information is presented in relation to the median (middle value) from the period January 3 - February 6, 2020.
The report includes 6 categories of places:
- Retail and Recreation (mobility trends in restaurants, cafes, shopping centers, amusement parks, museums, libraries, and cinemas)
- Grocery and Pharmacy (grocery stores of various sizes, markets, drugstores, and pharmacies)
- Parks (national parks, beaches, marinas, dog parks, public squares, and gardens)
- Transit Stations (metro stations, bus stops, train stations)
- Workplaces
- Residential
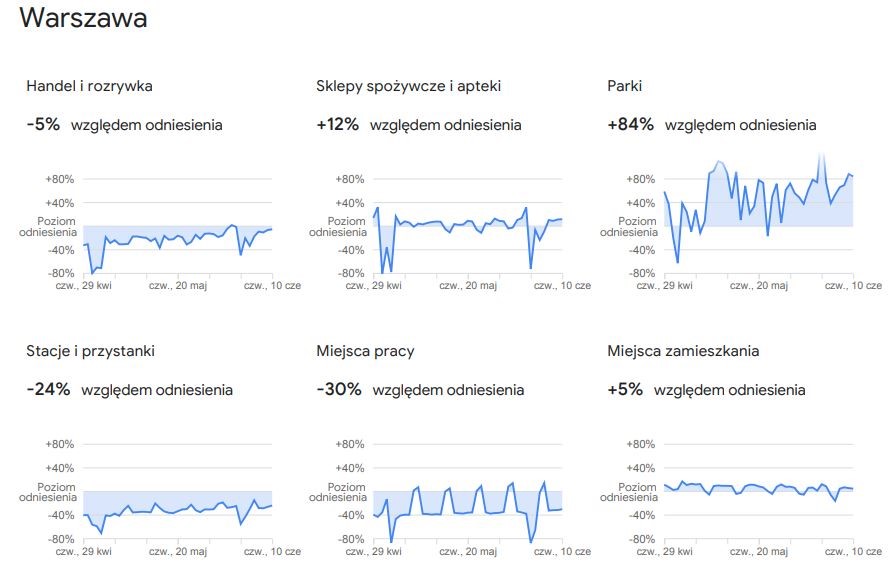
Here's how mobility trends have changed in Warsaw, according to the Google report:
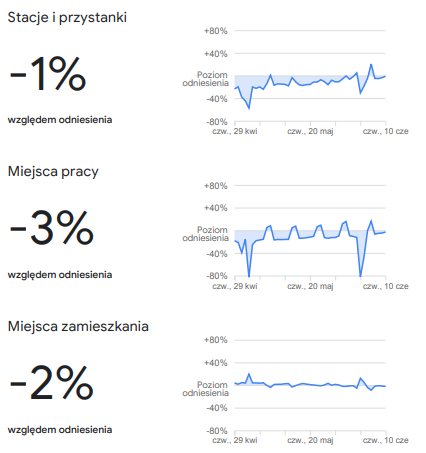
And here's how Google reports indicate changes in mobility trends across Poland:

Notes:
- The percentage values in the figures are not averages. They are the values on the day the report was generated, i.e., June 10, 2021.
- The data range in the charts covers the period after the lifting of the major restrictions.
- The charts cover a 43-day period: from April 29 to June 10, 2021.
- The charts show how movement in various places changed during the long weekends: May and June.
Changes in people's mobility over the last year are a fact, and many of them will likely remain for longer. Perhaps we will go to stores less often and, as a result, use online shopping more frequently. The possibility of remote work will probably mean we spend less time in workplaces.
Most Important:
However, the most important thing is that people's activity in public spaces is increasing and in many cases has exceeded pre-pandemic levels.
Let's remember that every research method has its limitations. In the case of the presented reports, we do not see absolute data, but only percentage differences. The value to which all data refers concerns winter 2020 – a pre-pandemic period, which is a completely different time than May or June. Hence, for example, movement in park areas is increasing.
A huge advantage of Google reports is certainly the data collected from a very large research group. Data is calculated and presented in all countries using the same method. Most importantly, we receive data concerning the entire world and its various regions with only a 2-4 day delay.
More:
More information and reports can be found here:
https://www.gstatic.com/covid19/mobility/2021-06-10_PL_Mobility_Report_pl.pdf
https://www.gstatic.com/covid19/mobility/2021-06-10_PL_Masovian_Voivodeship_Mobility_Report_pl.pdf