How much Do We Drive? Current Traffic Survey on National Roads
We now have the results of the great vehicle count on roads AD 2020. The latest traffic survey was conducted on the national road network, excluding sections managed by city-county presidents. Such measurements are carried out cyclically every 5 years and are called the General Traffic Measurement (GPR).
The previous traffic survey was conducted in 2015. Since 2020 was not a typical and reliable time for cyclical research, supplementary studies were conducted in 2021.
On November 16, 2021, the General Directorate for National Roads and Motorways (GDDKiA) published the latest data.
Why Conduct Traffic Surveys?
GPR data is used for making decisions about building new roads, modernizing existing ones, traffic management, economic and environmental analyses. We use them to determine the audience for advertisements on our Motorway 12x4m along national roads.
What Do the Results Include?
The measurement report contains an enormous amount of data. I'll highlight the most significant findings:
- In 2020, the national road network managed by GDDKiA totaled 18,256 km. Motorways and expressways make up only 20%, yet they carry over 50% of all national road traffic.
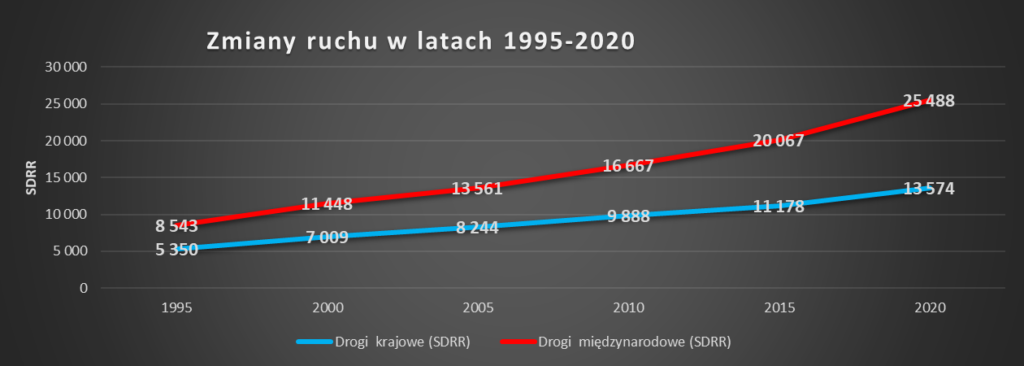
- The average annual daily traffic (AADT) of motor vehicles in 2020/21 on the national road network was 13,574 vehicles per day.
This was 21% higher than in the previous survey (GPR 2015: 11,178 vehicles per day). In the previously measured period (2010-2015), traffic growth was 14%. - The average annual daily traffic (AADT) of motor vehicles in 2020/21 on the international road network (part of national roads of major economic importance, e.g., A2, A1, A4, S7, etc.) was 25,488 vehicles per day.
This was 27% higher than in the previous survey (GPR 2015 - 20,067 vehicles per day)
The graph shows how traffic has changed over the last 25 years:
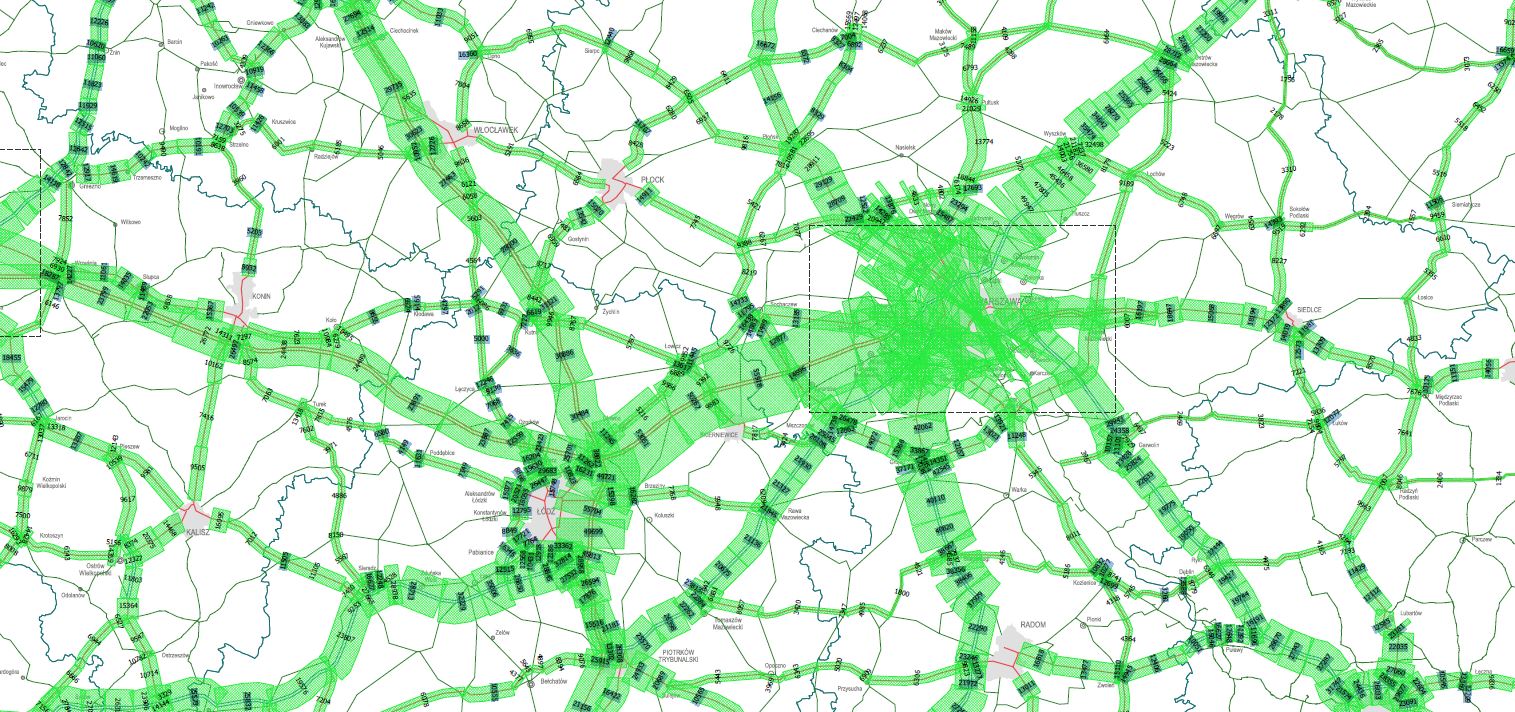
Traffic Varies across the Country
Traffic across various provinces is not uniform. Just like in the previous survey (from 2015), the highest traffic volume is in the Silesian province with 22,619 vehicles/day, which is 67% above average.
The lowest traffic volume is in the Warmian-Masurian province at 7,560 vehicles/day. This is 44% below average.
Traffic also varies depending on the technical class of the road. On motorways, it's 33,749 vehicles/day; on expressways - 25,167 vehicles/day; on main fast-traffic roads - 10,353 vehicles/day; on main roads - 5,900 vehicles/day.
The GPR study also shows the share of different motor vehicle categories in AADT on national roads. Details are shown in the graph below:

An important parameter in the study is night traffic, defined as traffic between 22:00-06:00. It amounts to 1,528 vehicles/8h and represents 11.3% of daily traffic. Passenger cars account for only 52% of this traffic.
Results showing traffic fluctuations throughout the year, i.e., information about which months have the highest and lowest traffic, will be published in the coming months. Besides national road traffic, GDDKiA also studied traffic on provincial roads. This data has not yet been published.
You can find the detailed report at this link: https://www.gov.pl/web/gddkia/wzrosl-ruch-na-drogach-krajowych---synteza-wynikow-generalnego-pomiaru-ruchu-202021