Road Traffic Returns to the Roads
In cities, the reduced road traffic during the pandemic is undeniable. Moving around the city between home, shops, and sometimes work, we mostly see empty streets. Places that were bustling with life not long ago are noticeably less crowded. Due to isolation and less frequent travel within Poland (and often none at all), we also don't see how traffic between cities in the country looks on a daily basis.
So: is Traffic Lower?
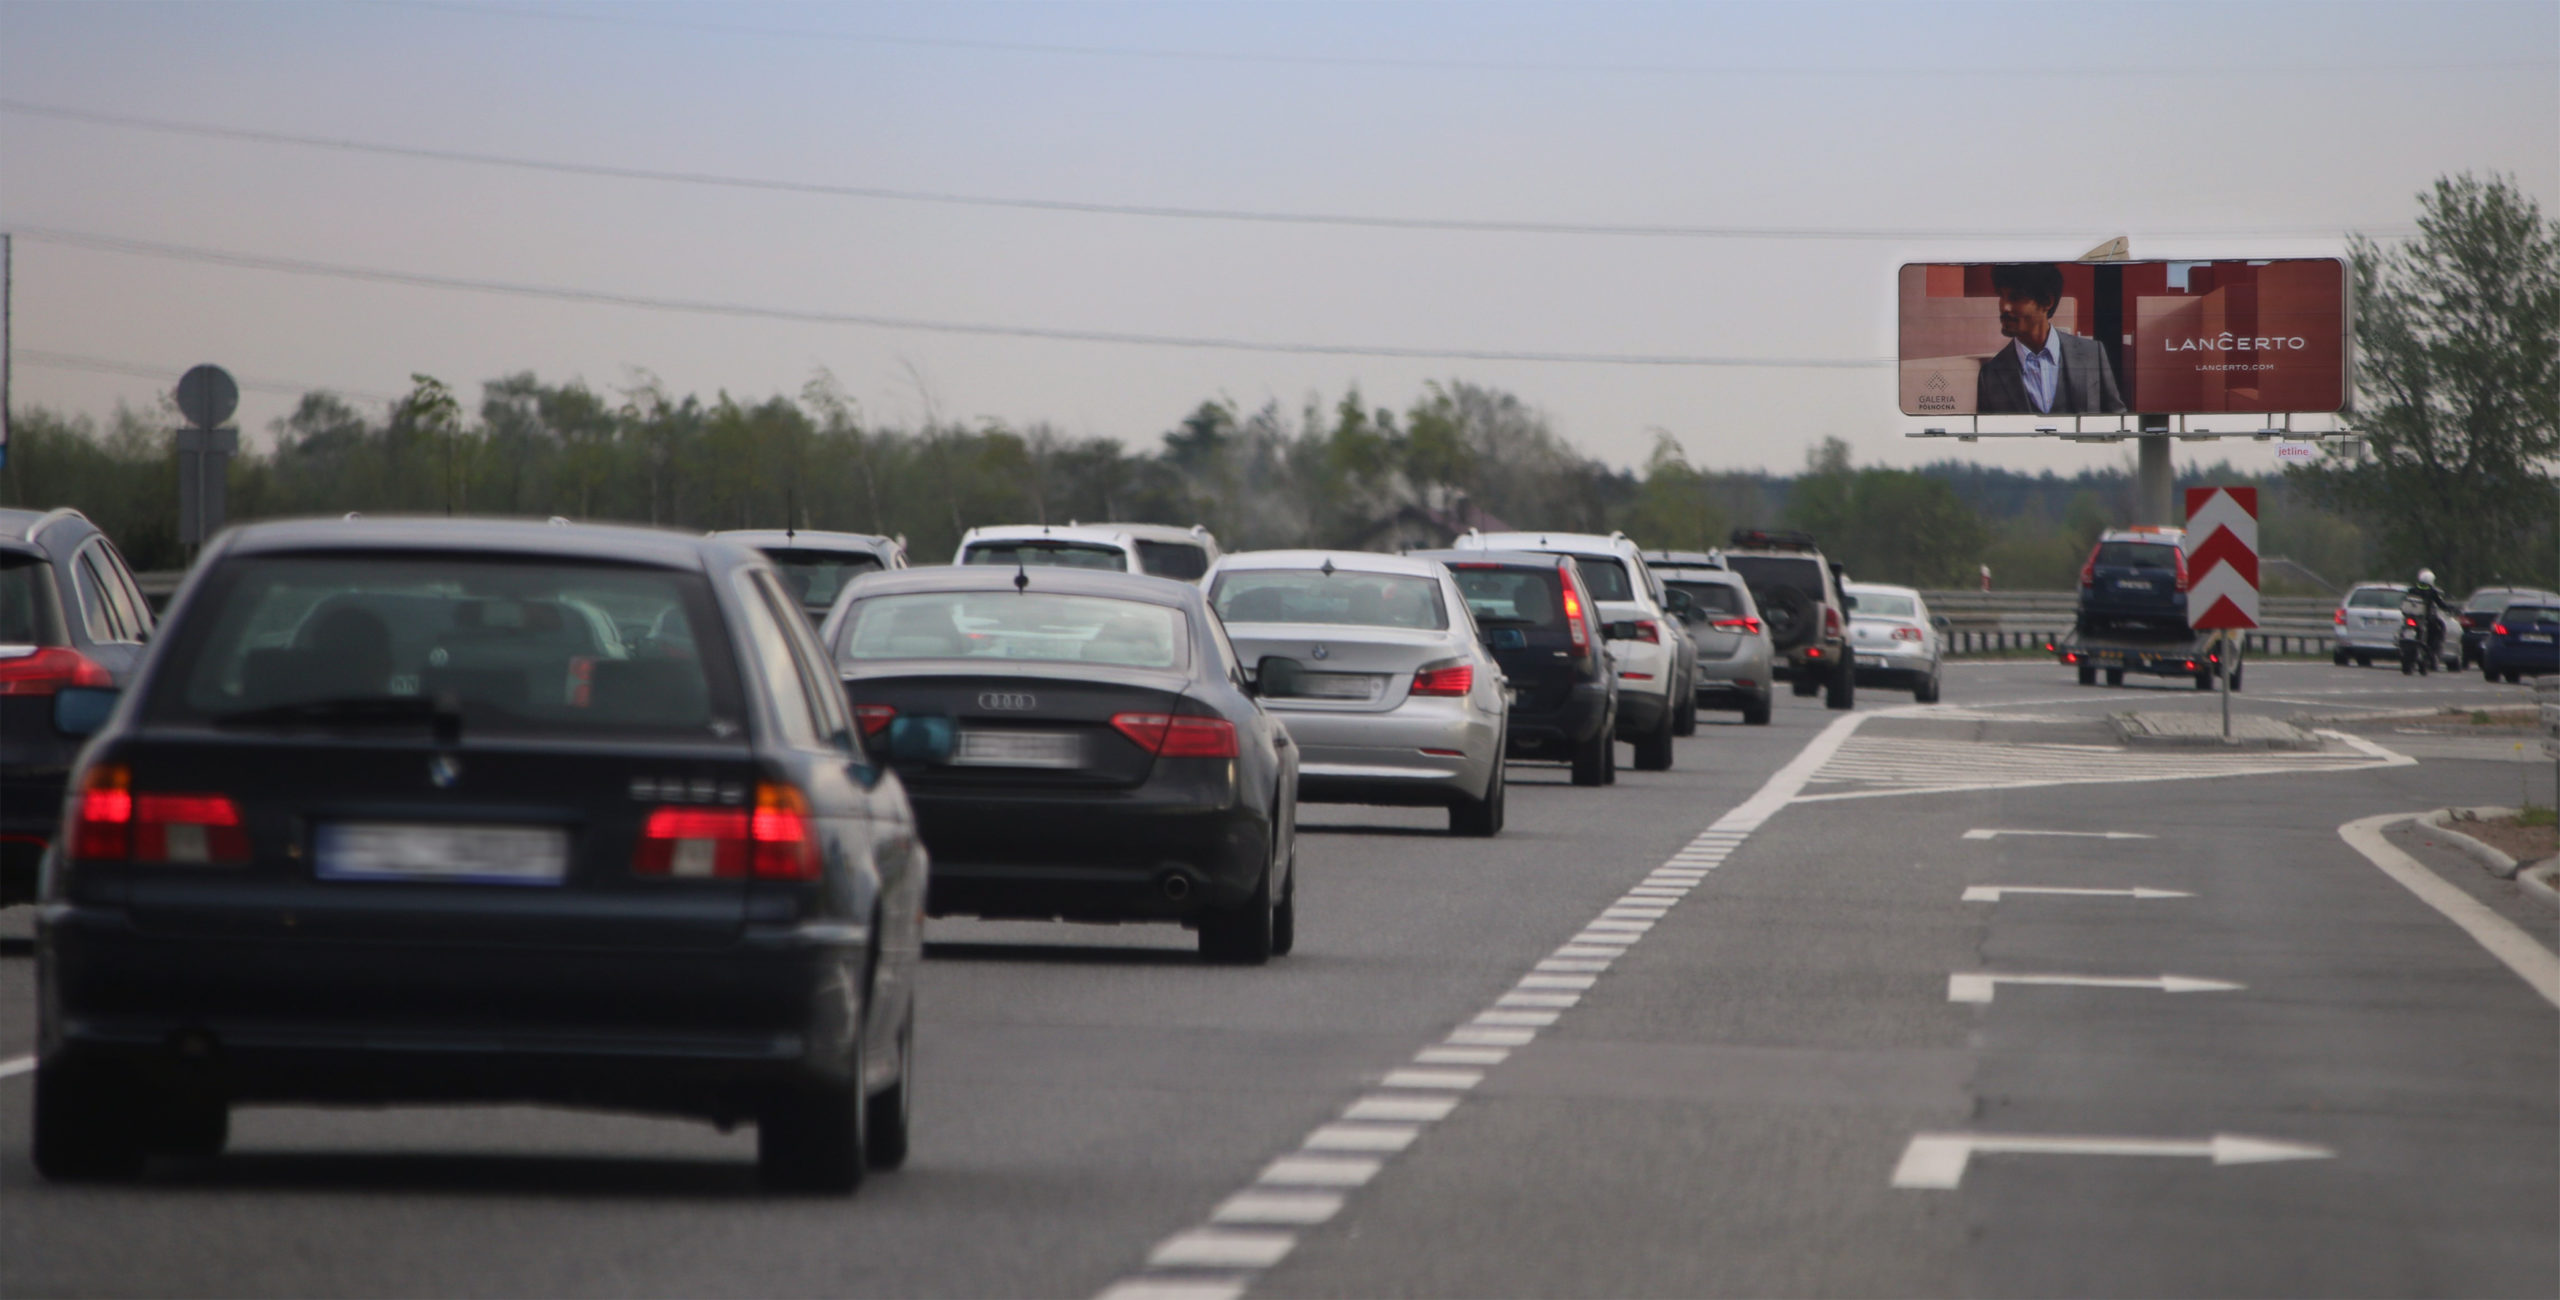
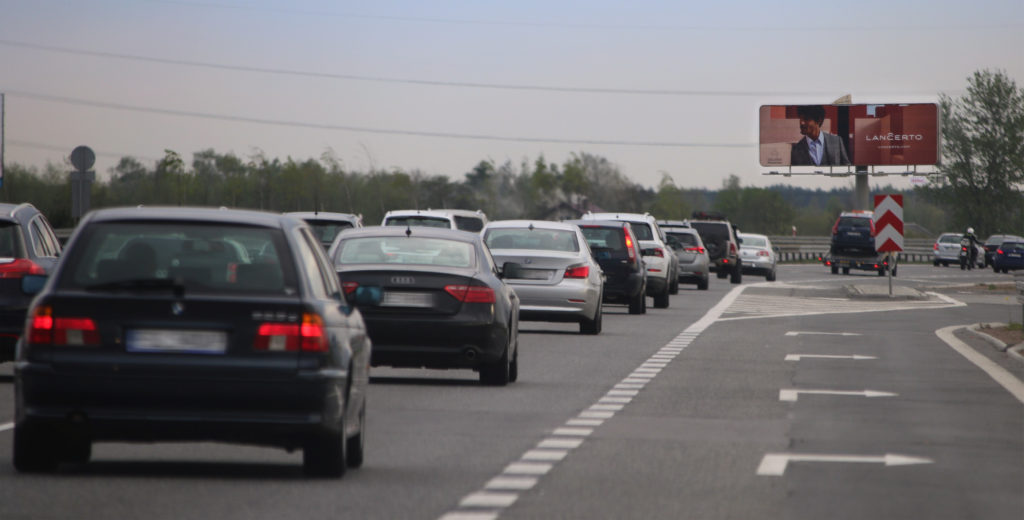
Roadside advertising is one segment of outdoor advertising. Thanks to measurements from the General Directorate for National Roads and Motorways (GDDKiA), we can determine how changes in its audience look. For us at Jet Line, traffic on the routes is a very important parameter. We rely on it to present the audience size of advertisements on our 12x4 m Motorway billboards. It is obvious that less traffic means a smaller audience. So: is traffic lower? I took the photo illustrating the article on Sunday, May 3, in the afternoon, on the Radzymin bypass, which is on the S8 route.
For several weeks now, I've been commuting to the office from my home near Warsaw, and I have the opportunity to observe how traffic intensity on the routes is changing. Today, returning to Warsaw, I felt exactly like a year ago. The only difference is that some drivers in nearby cars are wearing masks.
I will present a brief summary of how traffic looks on national roads in Poland. The analysis is based on GDDKiA data. Data is obtained through the electronic toll collection system and from automatic measurement stations. GDDKiA has over 100 such stations, collecting traffic intensity data continuously.
Traffic Intensity is an Important Parameter for Us
The basic parameter of traffic intensity is the SDR coefficient – Average Daily Traffic – which defines the number of vehicles moving on a given road section within 24 hours. SDRR – Average Annual Daily Traffic analogously defines the average daily traffic over a year. In this study (unless I indicate one direction), I refer to both directions of traffic combined.
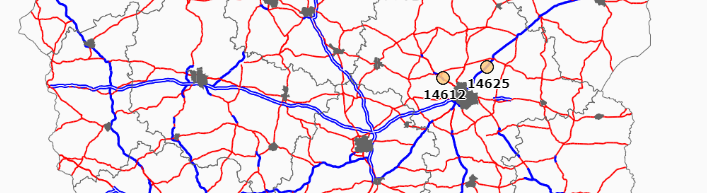
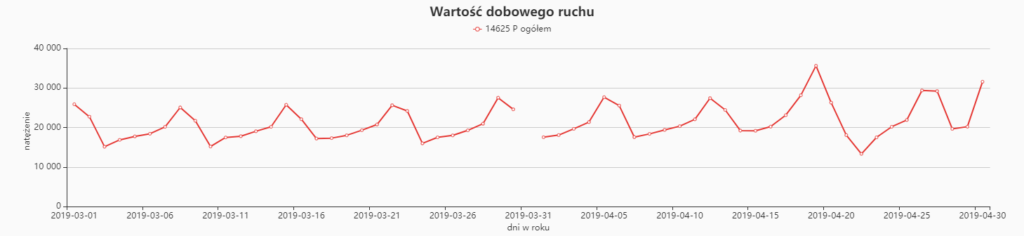
Below, I present a chart showing how traffic intensity has changed in the last two months, using two measurement stations as examples:
- point 14612 on the road between Warsaw and Gdańsk near Łomianki,
- point 14625 on the road between Warsaw and Białystok near Radzymin.
Changes in Traffic Intensity in March and April
The presented data is an example and not fully representative of the entire country. However, it perfectly shows the trend of the last 2 months. The chart below shows the changes that occurred from March 1 to April 29 of this year.
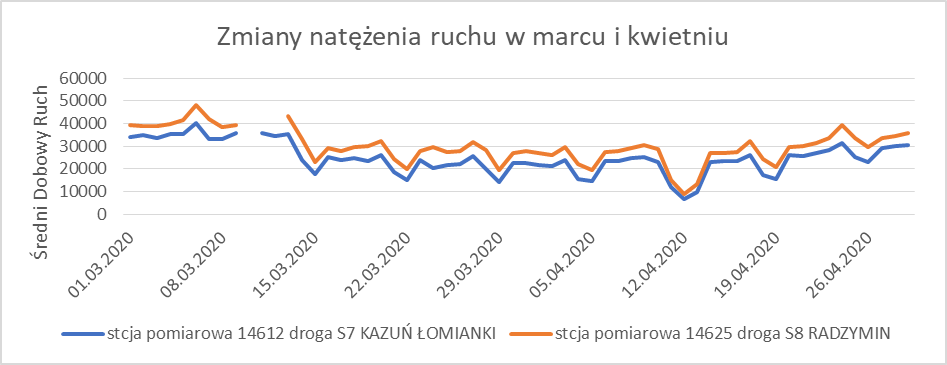
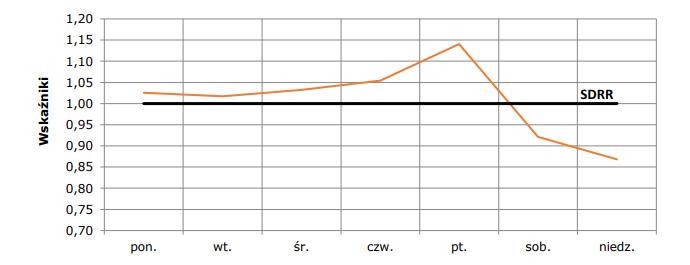
The initial segment (March 1-8) shows typical weekly fluctuations in daily traffic on road sections with economic traffic characteristics.
For better understanding, I present how such a distribution looked in 2018 for the entire country.
Returning to the first chart:
March 10-11 - the Polish government cancels mass events, schools, universities, kindergartens, and nurseries are closed, from March 14, a state of epidemic threat comes into force in Poland. During this time, there is a very large (approx. 30%) decrease in traffic intensity, and the weekly traffic distribution also changes significantly (on Saturdays and Sundays, SDR drops are very large).
March 24 - Poland introduces far-reaching movement restrictions. Gathering in parks and on boulevards is prohibited. This is another week where we observe declines.
March 31 - the government introduces further restrictions. This week also shows a decrease in traffic intensity.
April 9 - Easter restrictions. The government maintained all existing pandemic-related restrictions and added a new one: the obligation to cover one's face in public spaces. A campaign is being run in the media recommending staying home for the holidays.
In the week preceding the holidays, from Monday to Friday, slight increases can be observed. Easter itself saw the largest drops in traffic intensity on the roads. The presented chart shows that the SDR is only 20% of the value from the beginning of March – these were the 3 days with the largest drops in traffic intensity.
April 20 - restrictions related to the coronavirus were eased. It is now possible to relax in forests and parks, and more people can enter shops simultaneously.
Since the announcement of the first stage of easing restrictions, we have observed a steady increase in traffic intensity on the routes. The weekly traffic distribution is slowly approaching a typical distribution.
For comparison, I present how the daily traffic distribution looked in one direction of traffic during the analogous period in 2019 (Easter Sunday fell on April 21).
What is the Situation on the Roads (at our Two Measurement Points)?
To precisely show what road traffic looks like today at our two measurement points, I present a comparison of SDR values from Tuesday, 03.03.2020, and Tuesday, 28.04.2020. Tuesday is the day for which the SDR value is closest to the average (for a road with economic traffic characteristics).
- point 14612 – 33700 > 29990 vehicles/day, which is an 11% decrease (SDRR in 2018 = 37,125 vehicles/day).
- point 14625 – 39139 > 34600 vehicles/day, which is a 12% decrease (SDRR in 2018 = 39,064 vehicles/day).
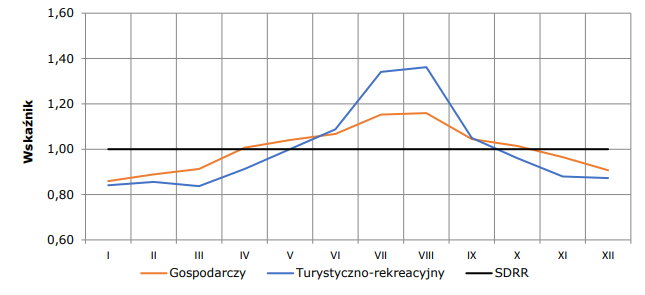
Let's also remember that traffic intensity changes depending on the month. Seasonal fluctuations in daily traffic for 2018 are shown in the chart:
According to the GDDKiA summary for the previous week (Tuesday, April 21), the differences in traffic intensity for all vehicles were as follows:
| Comparison of week 20-26.04.2020 with week 2-8.03.2020 | ||||||
| MON | TUE | WED | THU | FRI | SAT | SUN |
| -28% | -27% | -28% | -27% | -27% | -37% | -40% |
In the case of heavy vehicle traffic, changes were as follows:
| Comparison of week 20-26.04.2020 with week 2-8.03.2020 | ||||||
| MON | TUE | WED | THU | FRI | SAT | SUN |
| -13% | -12% | -12% | -12% | -12% | -17% | -10% |
When analyzing the presented data from the GDDKiA report, it should be noted that this is an average for a much larger number of measurement points. Road traffic decreases to varying degrees on different roads. The decreases are significantly larger on roads near border crossings or on roads with a tourist and recreational traffic character.
Why are Traffic Intensity Drops on Routes Significantly Smaller than in Cities?
Why does road traffic on routes show smaller decreases than in cities?
- the #stayathome restriction applies to those who can actually stay at home. The entire country cannot be shut down, the economy must function – this cannot be done without moving on the roads,
- car transport is safe – driving a car makes us feel safe, a bit like being at home, but on wheels??
rail transport is very heavily restricted; https://www.rynek-kolejowy.pl/wiadomosci/pkp-ic-o-94-pasazerow-mniej-z-powodu-pandemii-96300.html - bus communication between cities has practically ceased to exist. Warsaw's largest bus station, which recently handled over 300 buses daily, now only serves individual cases; https://pkspolonus.pl/aktualnosci/771-zmiana-rozkladu-jazdy-od-dnia-19-marca-2020-r-do-dnia-17-maja-2020-r
- air travel remains a memory;
- perhaps the low fuel price contributes to the high traffic on the routes.
Of course, let's remember that the situation is changing dynamically. The analysis does not cover the last weekend.
Meanwhile, on May 4, the second stage of the economy's "unfreezing" will come into effect. This will lead to increased traffic both in cities and on routes.
More analyses regarding traffic on national roads can be found at:
https://www.gddkia.gov.pl/pl/a/37470/Ruch-na-drogach-w-dobie-koronawirusa-Mamy-kolejne-statystyki