Traffic Analysis on Routes in 2020. Summary and Trend.
Traffic analysis is an important parameter for Jet Line. We base our investment plans and audience size information for Clients on it. Audience is key for OOH advertising.
Changes in Vehicle Traffic in 2020
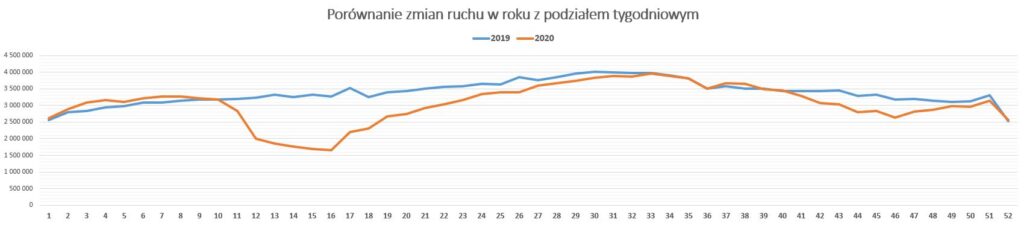
The chart above shows changes in traffic volume throughout the year, week by week. The most significant conclusions from the data analysis are:
- the total decrease in traffic volume in 2020 compared to 2019 was 9.5%. Such a small change indicates the relatively good condition of the economy in a very difficult year. It also confirms that budgets invested in OOH campaigns along national roads were a very good investment.
- traffic in the last week of 2019 and 2020 was almost the same, which is an optimistic forecast for 2021;
- the biggest decrease in traffic volume occurred in the 15th week of 2020 (April 2020), with traffic 49% lower than in the corresponding week of 2019;
- the biggest increase in traffic volume (after the pandemic announcement) occurred in the 38th week of 2020 (September 2020) and was nearly 4% higher than in the corresponding week of 2019;
The chart showing weekly traffic changes reveals differences resulting from movable holidays falling in different weeks of the year and the arrangement of long weekends. The introduction and lifting of COVID-related restrictions are also clearly visible.
Monthly Fluctuations in Vehicle Traffic
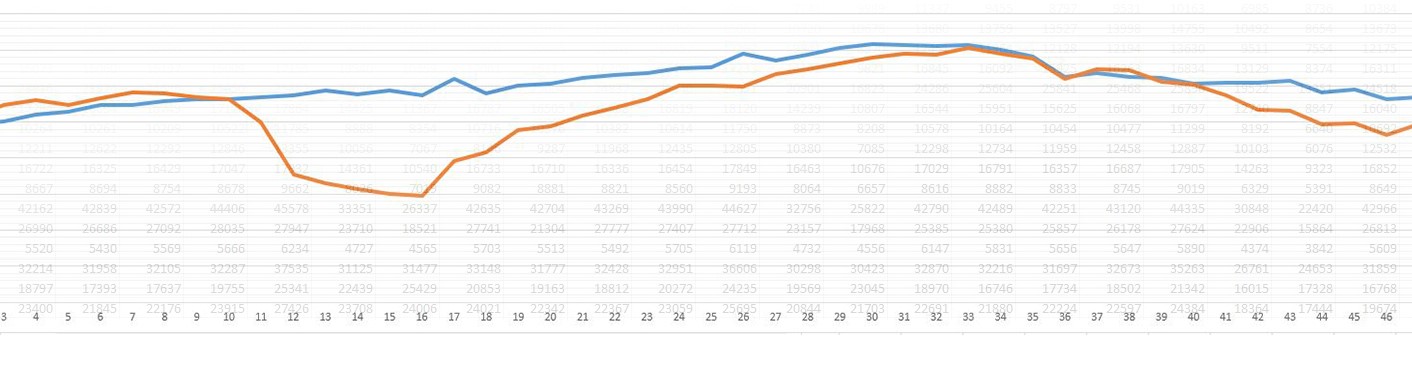
The charts below are more transparent. They show monthly traffic fluctuations.
Additionally, I've included a division into:
- roads between major cities in Poland, and
- roads leading to border crossings with Germany, Czech Republic, and Ukraine (but not at the border crossings themselves)

Let's note a few important facts:
- The decrease in traffic between cities in 2020 (compared to 2019) was 9.8%.
- The decrease in traffic near borders in 2020 (compared to 2019) was 6.7%.
- The biggest decreases were in April (42% between cities and 46.6% at borders).
- In January and February 2020, traffic was 4-8% higher than in the previous year. This is a natural process visible in GPR (General Traffic Measurement) studies conducted every 5 years by GDDKiA.
- Traffic between cities did not exceed the values achieved in 2019 in any month; only in September was it at a similar level.

The situation was different for border traffic. From July to September, traffic in 2020 was higher than in 2019, with the biggest difference reaching 10%.
The above differences and weekly GDDKiA reports also indicate that the share of different types of vehicles in total traffic has changed. In 2015, it was as follows:
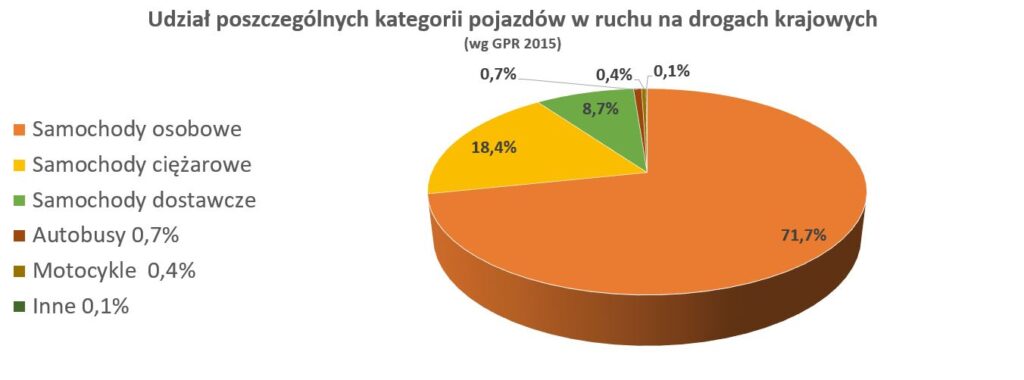
Since March 2020, there has been a higher percentage of trucks on the roads – which reflects positively on economic development. The share of buses has likely decreased significantly.
Daily Fluctuations in Vehicle Traffic
The final element of the analysis is the distribution of traffic fluctuations throughout the week:
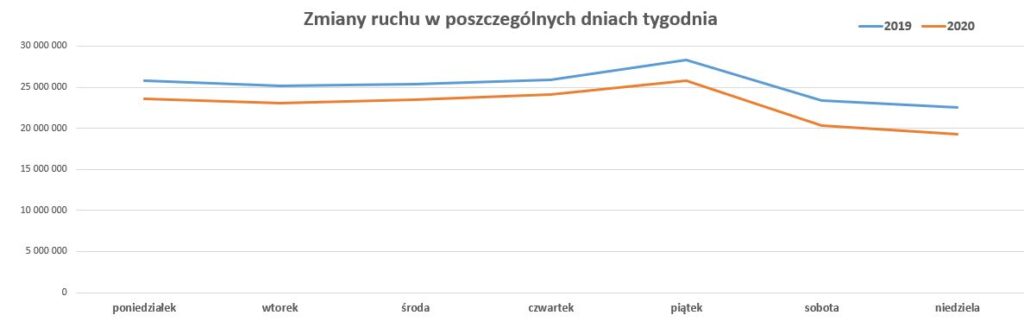
The smallest decreases in traffic volume were on Thursdays – 6.0%.
The largest decreases in traffic volume were on Sundays – 14.4%, and Saturdays – 12.8%.
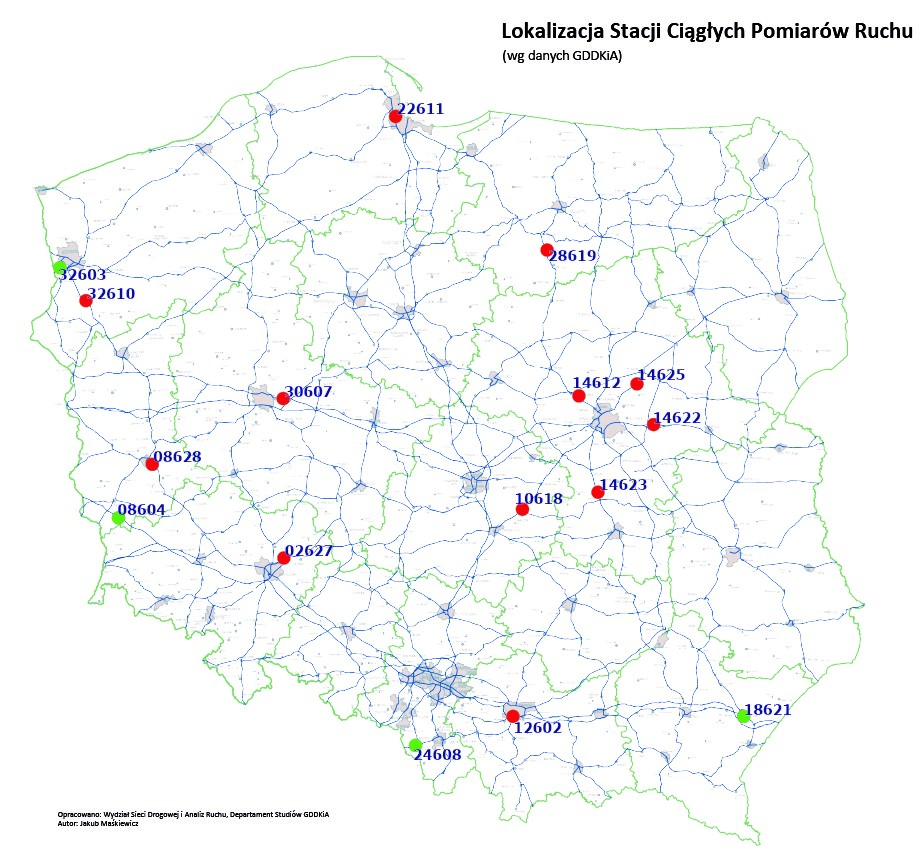
Where Does the Information about Vehicle Traffic in Poland Come from
I prepared this article based on data obtained from automatic measurement stations along routes: A2, A4, A6, A18, S1, S3, S6, S7, S8 and national roads 92 and 94. These are four sections of highways, five sections of expressways, and two national roads. Jet Line's Motorway 12x4m billboards are located along these routes (among others), where we run advertising campaigns for our Clients.
The analysis is based on measurements from 16 measuring stations (a total of 11.7 thousand daily ADT data), located mainly along international roads. Thanks to data from these stations, we continuously monitored how vehicle traffic changed in individual weeks and months of 2020.
These results cannot be applied to all national roads, but we can assume that the difference would not be significant.
For more details, I refer you to the report that will be published on the GDDKiA website in a few months.
Currently, reports describing weekly changes in traffic volume on national roads are available at: https://www.gddkia.gov.pl/pl/4296/Aktualnosci
Glossary:
GDDKiA – General Directorate for National Roads and Motorways;
GPR – General Traffic Measurement; a study conducted by GDDKiA every 5 years;
SDR – Average Daily Traffic;